
US light vehicle sales last month delivered a welcome surprise, beating analyst estimates to finish June with a 1.2% gain.
Automakers sold or leased more than 1.42m cars and light trucks last month, producing a seasonally adjusted annualised rate (SAAR) of nearly 17m units, the highest SAAR since July 2006.
Go deeper with GlobalData

Discover B2B Marketing That Performs
Combine business intelligence and editorial excellence to reach engaged professionals across 36 leading media platforms.
Chrysler hit 51 consecutive months of sales gains with a 9.2% improvement, the largest of the Detroit automakers. The Jeep and Ram brands were the main drivers, up 27.8% and 14%, respectively. Dealers delivered 5,000 of the new Chrysler 200 in its first full month on the market.
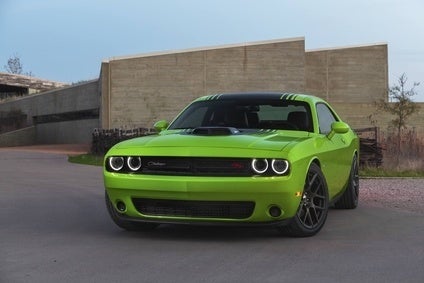
Chrysler had a busy day yesterday (1 July), celebrating the 100th anniversary of the Dodge brand and announcing that the new Hellcat Hemi engine will produce 707 horsepower (527 kW) and 650 lb ft of torque (881 Nm) in the 2015 Dodge Challenger SRT.
Ford’s June results were down 5.8% compared to June 2013. Ford brand sales were off 5.9%, primarily due to shortfalls in sales of the F-series pickup and E-series van [on run-out ahead of the launch of the new US-built Transit – ed]. Fleet sales were also off: Ford is the automaker most dependent on fleet sales.
General Motors’ results indicate there hasn’t been any significant consumer backlash after the record number of recalls this year, at least when it comes to buying a new GM vehicle. Chevrolet sales were down 2.5%, and sales of the larger Chevy sedans were off about 20%, but increases in deliveries of Buick and GMC brand vehicles more than made up the difference.
One anomaly: even though the price of oil was rising, sales of the largest SUVs, such as the Ford Expedition, Chevrolet Suburban and GMC Yukon were up 78.4% in June.
The same was not true for American full-size pickups, usually considered a bellwether for the economy. Volumes were down 3.5% with the Ram the only brand to beat the industry’s overall growth in sales.
Toyota and Nissan reported better than average results, but Honda took another tumble and is now in the red for the year.
Subaru reported another sales record but Mazda and Mitsubishi reported larger improvements. Long-suffering Mitsubishi is now 30.2% ahead of the first half of 2013, the second-largest gain of any automaker.
Hyundai also set a new June sales record while Kia had a record first half. The Korean automakers picked up a 10th of a point of market share.
Audi racked up its 42nd consecutive month of record sales, capping off the best first half in the brand’s history in the US. Porsche also set a new June record, thanks to the new Macan. Unfortunately, their results weren’t enough to overcome another disappointing month for Volkswagen and VW Group sales overall fell 8.3%.
The premium segment remained strong in June. BMW brand sales were up 11.5%, driven by deliveries of the 5 series and 7 series, overcoming an 18.2% slump in sales of the Mini line. BMW is building a solid lead over rival Daimler.
Mercedes-Benz sales rose 8.6% last month with the C Class and E Class leading the way.
Maserati continues to pace the industry in terms of growth. Fiat’s luxury brand reported 1,015 North American sales with 966 of those in the US.
Considering that last month had two fewer selling days than either June 2013 or May 2014, the results, and especially the SAAR, would seem to be most acceptable.
|
Manufacturer |
Current |
Volume |
Daily Sales |
Market |
Calendar |
Volume |
|||
|---|---|---|---|---|---|---|---|---|---|
|
June 14 |
June 13 |
June 14 |
June 13 |
2014 |
2013 |
||||
|
Chrysler Group |
171086 |
156686 |
9.2% |
18.3% |
12% |
11.2% |
1020123 |
908332 |
12.3% |
|
Ford Motor Co. |
221396 |
234917 |
-5.8% |
2.1% |
15.6% |
16.7% |
1265357 |
1289736 |
-1.9% |
|
General Motors Co. |
267461 |
264843 |
1% |
9.4% |
18.8% |
18.9% |
1455868 |
1420346 |
2.5% |
|
Detroit Total |
659943 |
656446 |
0.5% |
8.9% |
46.4% |
46.7% |
3741348 |
3618414 |
3.4% |
|
American Honda |
129023 |
136915 |
-5.8% |
2.1% |
9.1% |
9.7% |
739436 |
745578 |
-0.8% |
|
Mazda North America |
26208 |
22497 |
16.5% |
26.2% |
1.8% |
1.6% |
156431 |
144943 |
7.9% |
|
Mitsubishi |
6021 |
5297 |
13.7% |
23.1% |
0.4% |
0.4% |
39672 |
30469 |
30.2% |
|
Nissan North America |
109643 |
104124 |
5.3% |
14.1% |
7.7% |
7.4% |
704477 |
624709 |
12.8% |
|
Subaru* |
41367 |
39235 |
5.4% |
14.2% |
2.9% |
2.8% |
238008 |
204597 |
16.3% |
|
American Suzuki |
0 |
0 |
N/A |
N/A |
0% |
0% |
0 |
5946 |
-100% |
|
Toyota Motor Sales |
201714 |
195235 |
3.3% |
11.9% |
14.2% |
13.9% |
1165607 |
1108791 |
5.1% |
|
Japan Total |
513976 |
503303 |
2.1% |
10.6% |
36.1% |
35.8% |
3043631 |
2865033 |
6.2% |
|
Hyundai* |
67407 |
65007 |
3.7% |
12.3% |
4.7% |
4.6% |
364434 |
361010 |
0.9% |
|
Kia |
50644 |
50536 |
0.2% |
8.6% |
3.6% |
3.6% |
297413 |
277351 |
7.2% |
|
Korea Total |
118051 |
115543 |
2.2% |
10.7% |
8.3% |
8.2% |
661847 |
638361 |
3.7% |
|
BMW North America |
35577 |
33645 |
5.7% |
14.6% |
2.5% |
2.4% |
181534 |
172787 |
5.1% |
|
Daimler AG |
29380 |
27164 |
8.2% |
17.2% |
2.1% |
1.9% |
167754 |
155906 |
7.6% |
|
Jaguar Land Rover |
5301 |
5105 |
3.8% |
12.5% |
0.4% |
0.4% |
34503 |
30782 |
12.1% |
|
Maserati North America |
966 |
290 |
233.1% |
260.9% |
0.1% |
0% |
5442 |
1269 |
328.8% |
|
Volkswagen Group** |
50011 |
54567 |
-8.3% |
-0.7% |
3.5% |
3.9% |
287719 |
303552 |
-5.2% |
|
Volvo Cars North America |
5983 |
6678 |
-10.4% |
-2.9% |
0.4% |
0.5% |
29330 |
32578 |
-10% |
|
Other (est.) |
2775 |
1786 |
55.4% |
68.3% |
0.2% |
0.1% |
15780 |
14344 |
10% |
|
Europe Total |
129993 |
129235 |
0.6% |
9% |
9.1% |
9.2% |
722062 |
711218 |
1.5% |
|
Total Light Vehicles |
1421963 |
1404527 |
1.2% |
9.7% |
100% |
100% |
8168888 |
7833026 |
4.3% |
* indicates a sales record.
**Volkswagen Group figures include Audi, Bentley, Porsche and Volkswagen brands
Other includes estimated sales for Aston-Martin, Ferrari, Lamborghini, Lotus, Maybach, Rolls-Royce and Tesla
Source: Manufacturer’s reported sales


