
April US light vehicle sales rose 4.6% to about 1.45m cars and light trucks. That was a bit shy of analysts’ estimates but still healthy.
The seasonally adjusted annualised rate (SAAR) came in at 16.5m sales – in line with the trend set in recent years.
Go deeper with GlobalData

Discover B2B Marketing That Performs
Combine business intelligence and editorial excellence to reach engaged professionals across 36 leading media platforms.
Light trucks took 54.2% of April sales. Consumer preference for trucks seems to have become independent of petrol prices. Fuel prices have risen 10% in the past month but April’s truck share was 2% higher than March’s.
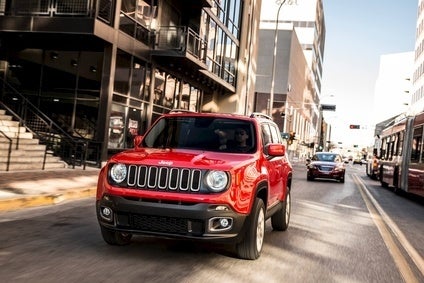
Crossovers and SUVs, led by FCA’s Jeep brand, increased their piece of the pie to 36.6%, three points higher than April 2014, as segment sales rose 36.2%.
This helps the Detroit automakers: General Motors reported the largest year over year growth of the three, driven by all-time-record crossover sales; Ford set an April record for utility turnover and FCA’s Jeep set a new all time record and repeated as the best selling utility brand.
Pickup sales grew 8.7% last month due to a 58% jump in mid-size pickup deliveries. Full-size pickup sales edged up by just 3.1%, falling behind the industry pace.
Deliveries of light commercial vehicles grew 15.9% with both components, full-size and small vans, ahead of the pace. Ford never missed a beat as the dominant player in the market as its vans accounted for 53% of total segment sales last month.
There were some standout performances among passenger cars: sales of the Chrysler 200 soared 348.4%, making it one of the top three American-badged cars for the month. Sales of the Jaguar F-Type were up 197.8%. BMW 7-Series deliveries increased 123.6%.
The premium market remains strong. Sales growth was more than twice the industry pace at 11.4%. Mercedes-Benz was the top performer, retaking the lead in the segment in both April and year to date (YTD) sales.
Porsche deliveries jumped 28.1% as sales topped the 5,000 mark for the first time since Porsche Cars North America took over importing and distribution in 1984. The Macan was the brand’s hero in April; sales would have fallen 9.6% without the junior Cayenne.
Audi set another monthly sales record which, along with Porsche’s numbers, overcame another drop in VW sales to put Volkswagen Group in the black. Audi passed Cadillac in YTD sales to take the fourth spot behind Lexus.
The Japanese and Korean automakers lost share in April. Most of that became Detroit’s gain but the European car companies picked up a few basis points, as well.
Toyota numbers came in well below analyst estimates, as did Honda’s.
Honda’s bread and butter Accord looks to have lost its marketplace mojo. Once a serious competitor to the Toyota Camry for segment leadership, it now trails not only the Camry and Corolla but the Nissan Altima and Ford Fusion, as well.
Scion was Toyota’s anchor: it combined with a shortfall in Camry and Avalon sales to drop Toyota car deliveries below the breakeven point. Stronger truck sales were able to keep Toyota on the bright side.
Subaru joined Mercedes, Audi, Porsche and Hyundai in celebrating new records. Mazda had its best April in 20 years while Ford reported its best April numbers since 2006. FCA recorded its 61st consecutive month of year over year sales gains and its best April since it was part of DaimlerChrysler.
Most analysts have raised their full-year 2015 forecasts to 17m light vehicles. Should the trends set so far in 2015 continue, it’s quite likely the industry could exceed that mark to hit as high as 17.2m sales.
| Manufacturer | Current Month | Volume | Daily Sales | Market Share | Calendar Year-To-Date | Volume | |||
|---|---|---|---|---|---|---|---|---|---|
| Apr-15 | Apr-14 | Change | Rate Change | Apr-15 | Apr-14 | 2015 | 2014 | Change | |
| FCA US LLC | 189,027 | 178,652 | 5.8% | 5.8% | 13.0% | 12.8% | 694,881 | 654,616 | 6.2% |
| Ford Motor Co. | 221,652 | 210,355 | 5.4% | 5.4% | 15.2% | 15.1% | 813,552 | 790,615 | 2.9% |
| General Motors Co. | 269,056 | 254,076 | 5.9% | 5.9% | 18.5% | 18.3% | 953,095 | 903,713 | 5.5% |
| Detroit Total | 679,735 | 643,083 | 5.7% | 5.7% | 46.7% | 46.2% | 2,461,528 | 2,348,944 | 4.8% |
| American Honda | 130,068 | 132,456 | -1.8% | -1.8% | 8.9% | 9.5% | 464,011 | 457,810 | 1.4% |
| Mazda North America | 24,123 | 22,434 | 7.5% | 7.5% | 1.7% | 1.6% | 102,167 | 100,492 | 1.7% |
| Mitsubishi | 8,216 | 6,542 | 25.6% | 25.6% | 0.6% | 0.5% | 32,006 | 26,382 | 21.3% |
| Nissan North America | 109,848 | 103,934 | 5.7% | 5.7% | 7.5% | 7.5% | 477,476 | 458,900 | 4.0% |
| Subaru* | 47,241 | 40,083 | 17.9% | 17.9% | 3.2% | 2.9% | 178,522 | 152,471 | 17.1% |
| Toyota Motor Sales | 203,329 | 199,660 | 1.8% | 1.8% | 14.0% | 14.4% | 778,949 | 720,657 | 8.1% |
| Japan Total | 522,825 | 505,109 | 3.5% | 3.5% | 35.9% | 36.3% | 2,033,131 | 1,916,712 | 6.1% |
| Hyundai* | 68,009 | 66,107 | 2.9% | 2.9% | 4.7% | 4.8% | 240,038 | 226,120 | 6.2% |
| Kia | 53,282 | 53,676 | -0.7% | -0.7% | 3.7% | 3.9% | 194,823 | 186,682 | 4.4% |
| Korea Total | 121,291 | 119,783 | 1.3% | 1.3% | 8.3% | 8.6% | 434,861 | 412,802 | 5.3% |
| BMW North America | 32,428 | 29,592 | 9.6% | 9.6% | 2.2% | 2.1% | 123,697 | 110,626 | 11.8% |
| Daimler AG* | 32,432 | 29,329 | 10.6% | 10.6% | 2.2% | 2.1% | 117,680 | 108,804 | 8.2% |
| Jaguar Land Rover | 6,390 | 5,568 | 14.8% | 14.8% | 0.4% | 0.4% | 27,702 | 23,362 | 18.6% |
| Maserati North America | 1,060 | 964 | 10.0% | 10.0% | 0.1% | 0.1% | 2,989 | 3,332 | -10.3% |
| Volkswagen Group** | 52,295 | 50,765 | 3.0% | 3.0% | 3.6% | 3.7% | 183,609 | 184,102 | -0.3% |
| Volvo Cars North America | 4,636 | 4,635 | 0.0% | 0.0% | 0.3% | 0.3% | 18,358 | 18,333 | 0.1% |
| Other (est.) | 2,150 | 1,941 | 10.8% | 10.8% | 0.1% | 0.1% | 8,152 | 7,764 | 5.0% |
| Europe Total | 131,391 | 122,794 | 7.0% | 7.0% | 9.0% | 8.8% | 482,187 | 456,323 | 5.7% |
| Total Light Vehicles | 1,455,242 | 1,390,769 | 4.6% | 4.6% | 100.0% | 100.0% | 5,411,707 | 5,134,781 | 5.4% |
* indicates a sales record.
**Volkswagen Group figures include Audi, Bentley, Porsche and Volkswagen brands
Other includes estimated sales for Aston-Martin, Ferrari, Lamborghini, Lotus, Rolls-Royce and Tesla
Source: Manufacturer’s reported sales


