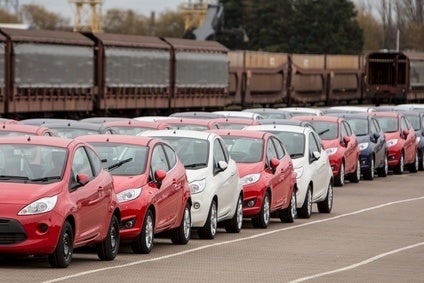
Car sales in Western Europe grew by 6.7% in April, as the recovery to the region’s car market benefited from a steadily improving economic picture.
According to data issued by LMC Automotive, Western Europe’s car market is up 8.2% in the first four months of the year.

Discover B2B Marketing That Performs
Combine business intelligence and editorial excellence to reach engaged professionals across 36 leading media platforms.
The result for April continues the solid start to the year as the economy in Europe continues to improve, boosting consumer and business sentiment across the region.
LMC Automotive has increased its forecast for the West European car market this year to 12.9m units, a 6.6% gain on 2014’s total.
“We’re seeing some momentum for the demand recovery in Europe now,” said LMC analyst Jonathon Poskitt. “The regional economy is picking up, boosted by the fall in energy prices, low inflation and growth of real wages. Confidence is rising. Also, after the low car markets of recent years, significant replacement demand is also being released on the back of that improving economic picture and continuing low interest rates which keep finance costs low – for fleet buyers and for private retail customers. It’s also still a very competitive marketplace.”
The German car market was up 6.3% in April, with growth led by company car sales. Company car sales in Germany are up almost 11% year-to-date, although that gain comes amid reports of heavy manufacturer activity to secure sales.
As has historically been the trend in the run up to a General Election, demand for new cars in the UK was up in April, leaving the UK car market so far this year up 6.4% on the same period of 2014. An annualise selling rate of 2.5m units a year paints a positive picture of growing confidence in the economy.
However, sales cooled off in Spain during April following the end of the PIVE Plan 7 scrappage scheme. However, LMC noted that the Spanish cae market has grown by 23.9% with the annualised selling rate hovering around the 1m units a year level. LMC also says that a strengthening Spanish economy together with another renewal of the PIVE Plan expected, augur well for Spanish car market prospects.
The Italian car market recorded its fourth consecutive month of double-digit growth, thanks to consumer confidence having improved somewhat from the start of the year. The selling rate picked up significantly in April to 1.7m units a year, the highest rate since September 2011.
In France, too, there was good news, with the market up and an April selling rate of 1.9m units a year as consumers continue to receive a boost from low energy prices and rising employment levels.
|
|
|
|
| Sales (units) | Selling rate (units/year) | |||||||||
|---|---|---|---|---|---|---|---|---|---|---|
| Apr | Apr | Percent | Year-to-date | Year-to-date | Percent | Apr | Year-to-date | Year | Percent | |
| 2015 | 2014 | change | 2015 | 2014 | change | 2015 | 2015 | 2014 | change | |
| WESTERN EUROPE | 1,123,748 | 1,052,844 | 6.70% | 4,522,834 | 4,179,691 | 8.20% | 12,980,953 | 12,858,114 | 12,102,107 | 6.20% |
| AUSTRIA | 32,131 | 29,240 | 9.90% | 107,285 | 110,521 | -2.9% | 308,299 | 308,330 | 303,318 | 1.70% |
| BELGIUM | 51,423 | 53,319 | -3.6% | 198,496 | 201,851 | -1.7% | 501,863 | 483,844 | 482,503 | 0.30% |
| DENMARK | 16,966 | 16,511 | 2.8% | 66,244 | 64,360 | 2.9% | 202,493 | 206,349 | 189,051 | 9.10% |
| FINLAND | 9,633 | 9,317 | 3.40% | 38,986 | 39,819 | -2.1% | 108,485 | 99,080 | 106,219 | -6.7% |
| FRANCE | 170,768 | 166,959 | 2.30% | 647,294 | 613,568 | 5.5% | 1,911,715 | 1,897,748 | 1,795,546 | 5.7% |
| GERMANY | 291,395 | 274,097 | 6.30% | 1,049,025 | 985,850 | 6.40% | 3,269,589 | 3,241,904 | 3,036,791 | 6.80% |
| GREECE | 5,531 | 5,444 | 1.60% | 22,802 | 22,046 | 3.40% | 63,680 | 64,676 | 71,217 | -9.2% |
| IRELAND | 9,471 | 7,822 | 21.10% | 74,319 | 57,675 | 28.90% | 113,411 | 117,388 | 96,283 | 21.9% |
| ITALY | 148,807 | 119,849 | 24.20% | 576,665 | 497,449 | 15.90% | 1,720,059 | 1,552,269 | 1,358,396 | 14.30% |
| LUXEMBOURG | 5,718 | 5,220 | 9.50% | 17,574 | 17,531 | 0.20% | 51,789 | 42,653 | 49,793 | -14.3% |
| NETHERLANDS | 27,148 | 28,281 | -4.0% | 138,068 | 135,311 | 2.00% | 362,160 | 373,430 | 388,438 | -3.9% |
| NORWAY | 12,782 | 12,115 | 5.5% | 48,149 | 48,607 | -0.9% | 152,727 | 147,640 | 144,202 | 2.4% |
| PORTUGAL | 14,993 | 12,314 | 21.80% | 61,215 | 46,274 | 32.3% | 178,677 | 183,400 | 142,812 | 28.40% |
| SPAIN | 82,715 | 80,189 | 3.20% | 349,849 | 282,342 | 23.90% | 974,586 | 995,660 | 855,295 | 16.40% |
| SWEDEN | 30,536 | 27,543 | 10.90% | 106,269 | 95,346 | 11.50% | 328,029 | 335,205 | 303,866 | 10.30% |
| SWITZERLAND | 27,952 | 27,804 | 0.50% | 100,227 | 96,199 | 4.20% | 301,515 | 303,019 | 301,942 | 0.40% |
| UK | 185,778 | 176,820 | 5.10% | 920,366 | 864,942 | 6.40% | 2,431,877 | 2,505,519 | 2,476,435 | 1.20% |
Austria, Greece, Luxembourg and Switzerland: estimates for latest month
The percent change in the final column compares the average selling rate in the year-to-date with the last full year.


