
It seems American new vehicle buyers went out of their way to confound the analysts in May.
Even with one less selling day and a tough May 2014 to beat, buyers turned a predicted 1.1% drop into a 1.6% gain, resulting in the best May sales month in US automotive history.
Discover B2B Marketing That Performs
Combine business intelligence and editorial excellence to reach engaged professionals across 36 leading media platforms.
Automakers reported better than 1.63m sales last month. The seasonally adjusted annualised rate (SAAR) came in at 17.8m, the highest since July 2005.
Audi, Kia, Subaru and Mercedes-Benz posted new records. Kia and Subaru hit all time record volumes while Audi achieved its 67th consecutive month of year over year gains.
‘Light trucks’ [which includes SUVs in the US – ed] continued to be preferred, accounting for 53.2% of May sales. A year ago, trucks’ share was 50.6%.
SUVs and crossovers, led by the Jeep brand, are still the hottest market segment.
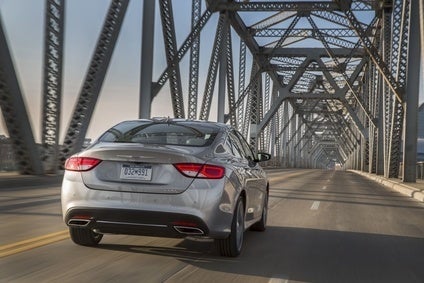
FCA hit 62 months of continuous growth as the Chrysler 200 and the Jeep Wrangler set new all time sales records. Chrysler’s results were hampered by the lack of minivans but the Windsor, Ontario plant is back online after retooling. The software problem that delayed shipments of the new Jeep Renegade and Fiat 500X has been resolved.
General Motors volume rose 3.0% thanks to robust light truck sales. While the Ford F-series was still the individual bestseller, GM was the pickup leader on total volume. The General’s four models captured 37.4% of total pickup deliveries. Sales of GM’s sport utilities rose a healthy 10.8%.
Ford sales were down slightly though the deficit was smaller than predicted. Supply problems continue to restrict shipments of the critical F-150 pickup and truck sales fell 5.2% in May. Total Ford SUV sales were also down slightly.
Ford’s picture did have a bright spot: its vans – now including two ‘European’ Transit models – enjoyed their best May since 1978.
American Honda’s namesake brand fell 0.3% on weak cars sales but Acura turnover covered the shortfall and kept the results in the black.
Strong truck sales couldn’t keep Toyota out of a hole. Toyota brand car sales fell 11.9% as Scion sales plunged 22.2%, wiping out a 14.6% improvement in light truck volumes. This was Toyota’s first down month since February 2014.
For the Hyundai Motor group, Kia’s all time sales record was wiped out by a 10.3% slump at larger sibling Hyundai. Total Korean volume fell 3.8% in May.
The European automakers were the big winners last month, adding a half percent to their total market share.
Mercedes-Benz reported another record but fell to third place in the premium rankings for the month. It still held a very slim lead in year to date (YTD) sales.
BMW reported a 12.8% jump in car sales and a 19.1% increase in Mini deliveries. BMW brand sales gave it the top spot in the premium segment, ahead of runner-up Lexus.
Volkswagen brand reported a 7.6% increase in sales, driven by the new Golf in its several forms. VW is pushing its numbers through extremely generous leases of the Jetta. According to reports, some dealers are offering Jetta leases for as little as GBP58/month.
For the first five months of 2015, light vehicle sales were in line with previous growth years. May could be the best sales month of the year, with the possible exception of December but, if the trend continues, a 17m sale year looks to be on the cards for automakers.
| Manufacturer | Current Month | Volume | Daily Sales | Market Share | Calendar Year-To-Date | Volume | |||
|---|---|---|---|---|---|---|---|---|---|
| May-15 | May-14 | Change | Rate Change | May-15 | May-14 | 2015 | 2014 | Change | |
| FCA US LLC | 202,227 | 194,421 | 4.0% | 8.0% | 12.4% | 12.1% | 897,108 | 849,037 | 5.7% |
| Ford Motor Co. | 250,086 | 253,346 | -1.3% | 2.5% | 15.3% | 15.7% | 1,063,638 | 1,043,961 | 1.9% |
| General Motors Co. | 293,097 | 284,694 | 3.0% | 6.9% | 17.9% | 17.7% | 1,246,192 | 1,188,407 | 4.9% |
| Detroit Total | 745,410 | 732,461 | 1.8% | 5.7% | 45.6% | 45.5% | 3,206,938 | 3,081,405 | 4.1% |
| American Honda | 154,593 | 152,603 | 1.3% | 5.2% | 9.5% | 9.5% | 618,604 | 610,413 | 1.3% |
| Mazda North America | 29,606 | 29,731 | -0.4% | 3.4% | 1.8% | 1.8% | 131,773 | 130,222 | 1.2% |
| Mitsubishi | 9,575 | 7,269 | 31.7% | 36.8% | 0.6% | 0.5% | 41,581 | 33,651 | 23.6% |
| Nissan North America | 134,779 | 135,934 | -0.8% | 3.0% | 8.2% | 8.4% | 612,255 | 594,834 | 2.9% |
| Subaru* | 49,561 | 44,170 | 12.2% | 16.5% | 3.0% | 2.7% | 228,083 | 196,641 | 16.0% |
| Toyota Motor Sales | 242,579 | 243,236 | -0.3% | 3.6% | 14.8% | 15.1% | 1,021,528 | 963,893 | 6.0% |
| Japan Total | 620,693 | 612,943 | 1.3% | 5.2% | 38.0% | 38.1% | 2,653,824 | 2,529,654 | 4.9% |
| Hyundai | 63,610 | 70,907 | -10.3% | -6.8% | 3.9% | 4.4% | 303,648 | 297,027 | 2.2% |
| Kia* | 62,433 | 60,087 | 3.9% | 7.9% | 3.8% | 3.7% | 256,815 | 246,769 | 4.1% |
| Korea Total | 126,043 | 130,994 | -3.8% | -0.1% | 7.7% | 8.1% | 560,463 | 543,796 | 3.1% |
| BMW North America | 36,836 | 35,331 | 4.3% | 8.3% | 2.3% | 2.2% | 160,533 | 145,957 | 10.0% |
| Daimler AG* | 33,189 | 29,570 | 12.2% | 16.6% | 2.0% | 1.8% | 150,868 | 138,374 | 9.0% |
| Jaguar Land Rover | 6,586 | 5,840 | 12.8% | 17.1% | 0.4% | 0.4% | 34,288 | 29,202 | 17.4% |
| Maserati North America | 1,341 | 1,144 | 17.2% | 21.7% | 0.1% | 0.1% | 4,330 | 4,476 | -3.3% |
| Volkswagen Group** | 57,698 | 53,606 | 7.6% | 11.8% | 3.5% | 3.3% | 241,300 | 237,708 | 1.5% |
| Volvo Cars North America | 5,023 | 5,014 | 0.2% | 4.0% | 0.3% | 0.3% | 23,381 | 23,347 | 0.1% |
| Other (est.) | 2,133 | 1,924 | 10.9% | 15.1% | 0.1% | 0.1% | 10,661 | 9,614 | 10.9% |
| Europe Total | 142,806 | 132,429 | 7.8% | 12.0% | 8.7% | 8.2% | 625,361 | 588,678 | 6.2% |
| Total Light Vehicles | 1,634,952 | 1,608,827 | 1.6% | 5.5% | 100.0% | 100.0% | 7,046,586 | 6,743,533 | 4.5% |
* indicates a sales record.
**Volkswagen Group figures include Audi, Bentley, Porsche and Volkswagen brands
Other includes estimated sales for Aston-Martin, Ferrari, Lamborghini, Lotus, Rolls-Royce and Tesla
Source: Manufacturer’s reported sales


