Sales Summary
According to preliminary estimates, US Light Vehicle (LV) sales fell by 4.3% YoY in June, to 1.26 million units. June 2025 had two fewer selling days as compared to June 2024, meaning that sales grew by 3.6% YoY on a selling day-adjusted basis. The daily selling rate was measured at 52.6k units/day in June, down from 54.5k units/day in May.

The annualized selling rate was estimated at 15.2 million units/year in June, down from 15.4 million units/year in May. Retail sales were estimated at 1.03 million units, down by 0.4 % YoY, while fleet sales were thought to total 236k units, down by 18.3% YoY. For the first half of the year, sales grew by 3.7% YoY. The annualized selling rate averaged 16.3 million units/year for the first six months overall, but slowed from 16.5 million units/year in Q1, to 16.0 million units/year in Q2.

OEM Analysis
In June, GM remained the bestselling OEM in the market, with total sales of 218k units and a market share of 17.3%. However, this is preliminarily GM’s lowest market share since August 2024. Toyota Group once again came in second, on 193k units, for a 15.3% share, while Ford Group was third on 177k units, with a 14.0% share. Looking at the first six months of the year, the same three OEMs comprised the top three in the sales rankings, in the same order. At a brand level, Ford led sales in June, on 169k units, beating Toyota by 4k units. This was the first time since December 2024 that Ford has outsold Toyota. Chevrolet was a distant third, on 139k units.
Model Analysis

US Tariffs are shifting - will you react or anticipate?
Don’t let policy changes catch you off guard. Stay proactive with real-time data and expert analysis.
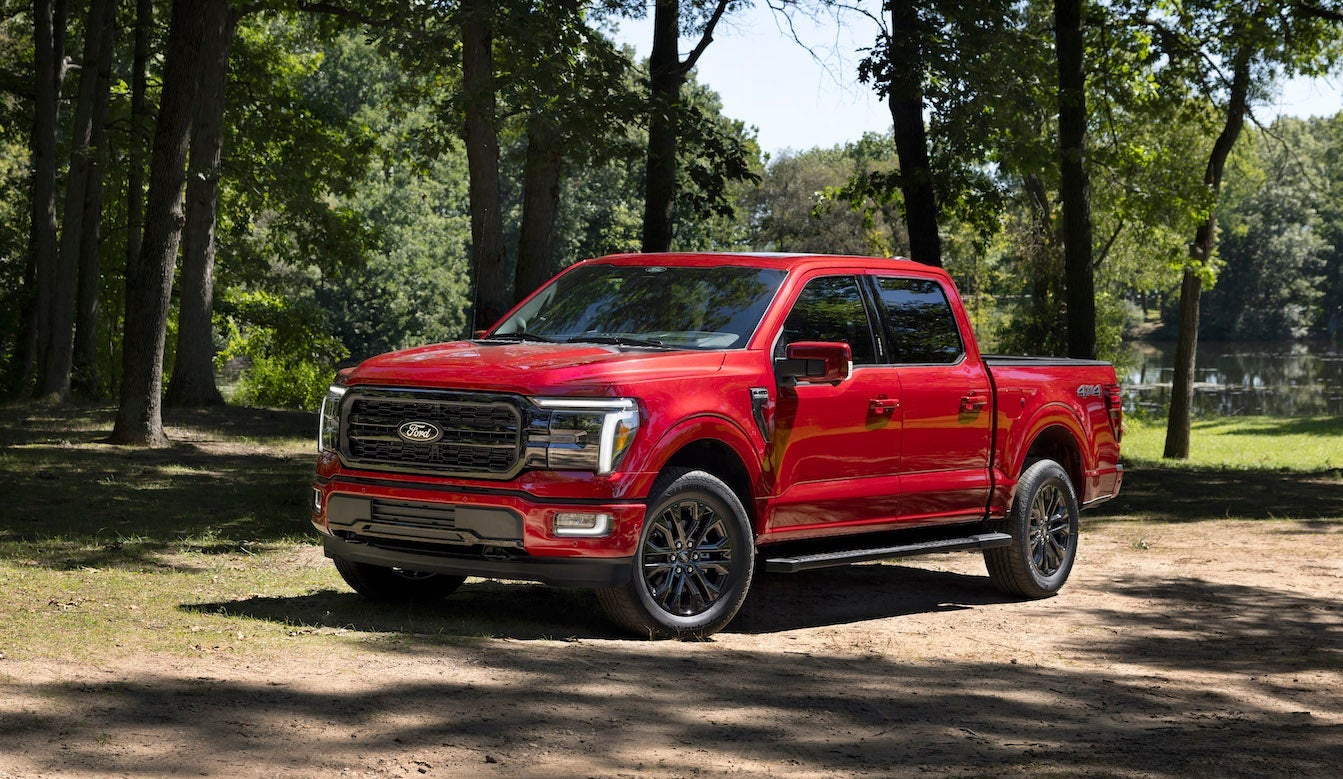
By GlobalDataThe Ford F-150 topped the sales rankings in June, on 43.3k units. This result meant that the F-150 was the bestselling model in the market in each month of Q2. Moreover, the gap to the next highest-selling model, the Toyota RAV4, was 6.5k units in June, and the F-150 had not previously had such an advantage over the RAV4 in exactly two years. The Chevrolet Silverado finished June in third place, for a second straight month. Looking at H1 2025 as a whole, the F-150 also beat the RAV4, with total sales of around 246k units, 6k ahead of the RAV4. The Honda CR-V was in third place, on 213k units. For comparison, in H1 2024 the RAV4 outsold the F-150 by around 31k units.
Segment Analysis
According to initial estimates, Compact Non-Premium SUV’s market share was 21.1% in June, up by 0.1 pp from May’s result. Midsize Non-Premium SUV was once again the second bestselling segment in June, with a market share of 15.2%, but this was the lowest share for the segment since March. Large Pickup had a strong month, and its market share of 14.7% was the second highest ever for the month of June, behind only June 2020 – which was somewhat exceptional due to unique conditions in the early stages of the pandemic. Despite a slight softening in share in recent months, Compact Non-Premium’s market share for H1 2025 was 21.7%, up by 0.3 pp YoY. Midsize Non-Premium SUV lost 0.5 pp YoY in H1, to 15.1%, while Large Pickups gained 0.5 pp YoY, to 13.5%.
David Oakley, Manager, Americas Sales Forecasts, GlobalData, said: “Despite a generally gloomy mood enveloping the automotive industry, June sales were not as poor as might have been expected under the circumstances. There were a number of factors complicating the analysis of the month’s sales. Firstly, two fewer selling days in June 2025 than in June 2024 made the YoY comparison somewhat challenging. Counteracting this effect, however, June 2025 was flattered by the fact that the CDK cyberattack impacted sales activity in June 2024. Overlaying all of this is an atmosphere in which regular efforts to boost volumes at the end of Q2 were muted, as tariffs cause OEMs to rein in incentive spending. In addition, some brands noted that inventory was becoming tight on certain models. Taking a step back, H1 2025 saw around 8.14 million units sold, the strongest first half to the year since 2021. However, with the pull-forward effect ahead of tariff implementation now over, we continue to forecast a significantly slower H2. Although the selling rate remained above 15 million units/year in June, the month was largely in line with the expected downward trend as we head into the second half of the year. An additional curve ball will be the phasing out of tax rebates for EV purchases, which could lead to an initial surge in EV sales during H2 2025, before a dramatic slump once the rebates are no longer available”.

Forecast Updates
We still expect 2025 sales to come in at around 15.2 million units, down from almost 16.0 million units in 2024, and representing a YoY decline of around 5%. In Q3 and Q4, we expect remaining pre-tariff inventory to dry up and be replaced by vehicles that were subject to import taxes, either on the finished vehicle itself, or on component parts. While OEMs are certainly trying hard to avoid hiking MSRPs, there is a limit to how long automakers can absorb higher costs, and there could be larger-than-normal uplifts on pricing as we see more 2026 model year vehicles enter the market. Currently, there are no indications of an imminent breakthrough in trade negotiations with key partners, and we do not expect any change to the status quo until next year. Still, our forecast also assumes a wider economic slowdown, and so a more robust performance could keep vehicle sales flowing more freely in H2, and creates some upside risk to our outlook.
This article was first published on GlobalData’s dedicated research platform, the Automotive Intelligence Center.