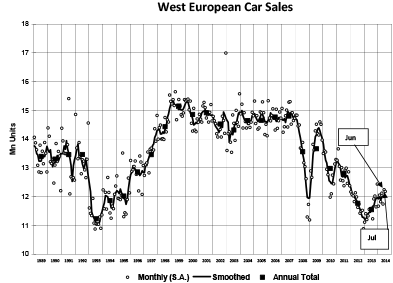
Car sales in Western Europe grew by 5% in July according to data released by LMC Automotive. The most recent month’s result indicates that the recovery remains on track. The Seasonally Adjusted Annualised Rate (SAAR) of sales stood at 12.2m units a year, similar to the previous month.
In Germany sales were up by 6.8% – the year-to-date market was up by 3%. The strong improvement seen in the largest market in Europe reflects the backdrop of generally improving consumer confidence, LMC said.

Discover B2B Marketing That Performs
Combine business intelligence and editorial excellence to reach engaged professionals across 36 leading media platforms.
The UK grew well once again in year-on-year terms, and while the selling rate eased back from recent months, generally the market looks to have fully recovered to pre-financial crisis levels.
The Spanish market expanded for the eleventh consecutive month. Despite struggling with cripplingly high unemployment, consumer confidence is in somewhat better shape than it was last year, and sales continue to be aided by the ongoing implementation of the PIVE scrappage incentive scheme.
The Italian market was also higher, though the selling rate weakened from recent months. The Italian government is considering new tax incentives to assist the car market there which, depending on the level of support, could rapidly improve the fortunes on this struggling market.
French registrations slipped back, though there was one fewer selling day for July 2014 versus 2013. A selling rate of just over 1.8m units a year implies that demand remains fairly muted.


|
Sales(units) |
||||||
|---|---|---|---|---|---|---|
|
July ’14 |
July ’13 |
% change |
YTD 2014 |
YTD 2013 |
% change |
|
|
WESTERN EUROPE |
1002226 |
954248 |
5% |
7390661 |
7011992 |
5.4% |
|
AUSTRIA |
28602 |
28543 |
0.2% |
195209 |
199747 |
-2.3% |
|
BELGIUM |
35275 |
34879 |
1.1% |
323099 |
324752 |
-0.5% |
|
DENMARK |
14267 |
14320 |
-0.4% |
113063 |
106285 |
6.4% |
|
FINLAND |
8016 |
8454 |
-5.2% |
67145 |
65008 |
3.3% |
|
FRANCE |
143777 |
150218 |
-4.3% |
1102528 |
1081694 |
1.9% |
|
GERMANY |
270249 |
253146 |
6.8% |
1808517 |
1755776 |
3% |
|
GREECE |
7734 |
6462 |
19.7% |
45208 |
36826 |
22.8% |
|
IRELAND |
18776 |
11603 |
61.8% |
84657 |
64855 |
30.5% |
|
ITALY |
113777 |
108338 |
5% |
871334 |
840660 |
3.6% |
|
LUXEMBOURG |
4517 |
3905 |
15.7% |
31662 |
30314 |
4.4% |
|
NETHERLANDS |
29867 |
30476 |
-2.0% |
228856 |
241275 |
-5.1% |
|
NORWAY |
11690 |
11312 |
3.3% |
84075 |
81956 |
2.6% |
|
PORTUGAL |
14169 |
10843 |
30.7% |
89941 |
65877 |
36.5% |
|
SPAIN |
83223 |
75027 |
10.9% |
538163 |
461372 |
16.6% |
|
SWEDEN |
20473 |
18161 |
12.7% |
172220 |
147106 |
17.1% |
|
SWITZERLAND |
24907 |
26333 |
-5.4% |
174812 |
182638 |
-4.3% |
|
UK |
172907 |
162228 |
6.6% |
1460172 |
1325851 |
10.1% |
|
Selling rate (units/year) |
||||
|---|---|---|---|---|
|
July ’14 |
YTD 2014 |
Year 2013 |
% change |
|
|
WESTERN EUROPE |
12177726 |
11973640 |
11545761 |
3.7% |
|
AUSTRIA |
328896 |
315869 |
319035 |
-1.0% |
|
BELGIUM |
494318 |
487048 |
486065 |
0.2% |
|
DENMARK |
172763 |
192454 |
182198 |
5.6% |
|
FINLAND |
107195 |
102728 |
103451 |
-0.7% |
|
FRANCE |
1817742 |
1807275 |
1790320 |
0.9% |
|
GERMANY |
3251326 |
3062992 |
2952431 |
3.7% |
|
GREECE |
71983 |
67990 |
58696 |
15.8% |
|
IRELAND |
101057 |
96420 |
74309 |
29.8% |
|
ITALY |
1281736 |
1348410 |
1302928 |
3.5% |
|
LUXEMBOURG |
50879 |
47424 |
46624 |
1.7% |
|
NETHERLANDS |
420682 |
353091 |
417156 |
-15.4% |
|
NORWAY |
129196 |
143935 |
142151 |
1.3% |
|
PORTUGAL |
146738 |
142384 |
105915 |
34.4% |
|
SPAIN |
844822 |
830465 |
722693 |
14.9% |
|
SWEDEN |
307498 |
303921 |
269167 |
12.9% |
|
SWITZERLAND |
291430 |
287749 |
307885 |
-6.5% |
|
UK |
2359465 |
2383485 |
2264737 |
5.2% |
Notes: Austria, Greece, Luxembourg an d Switzerland : estimates for latest month
The percent change in the final column compares the average selling rate in the year-to-date with the last full year.


