
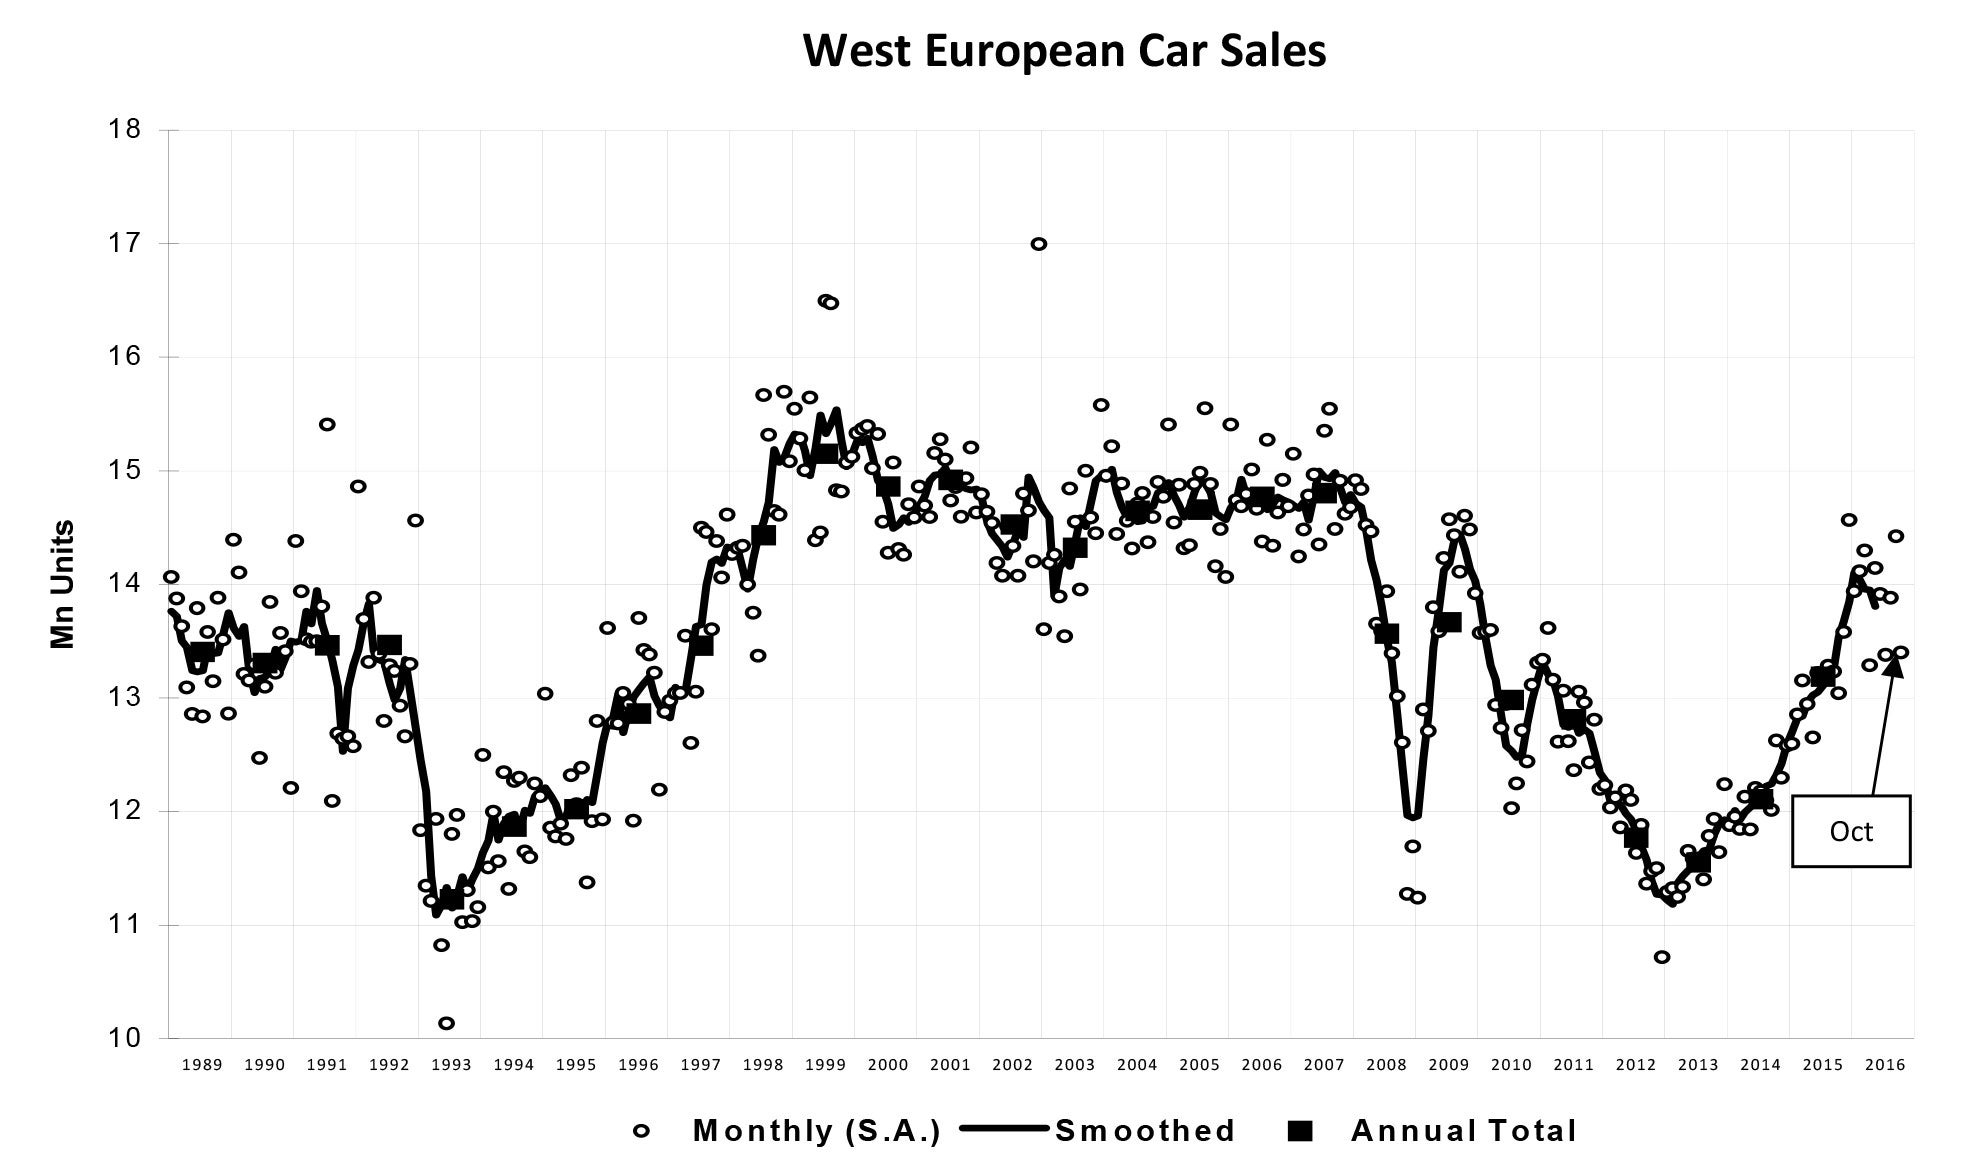
Car sales in Western Europe fell by 1% year-on-year (YoY) in October, with one fewer selling day, according to data released by LMC Automotive.
LMC said the annualised sales rate for the region dipped to a disappointing 13.4m units a year.
Go deeper with GlobalData

Discover B2B Marketing That Performs
Combine business intelligence and editorial excellence to reach engaged professionals across 36 leading media platforms.
Car sales were down 5.6% in Germany, while the French car market was down 4%.
The Spanish car market cooled in October, growing by just 4% on last year, contrasting with double-digit growth rates earlier in the year. Spain’s car market is now adjusting to the end of the PIVE scrappage scheme.
However, car sales in Italy maintained strong growth, with a 9.7% gain.
LMC said the UK car market has, so far, not shown any major after-effects from the June Brexit vote with new registrations up 1.4% in October.
So far this year, the West European car market is up by 6.3% and LMC says it remains on course to finish the year at 13.9m units, a solid improvement over the 13.2m units for 2015. LMC forecasts further growth in 2018, albeit at a slower pace headwinds in the form of higher car prices and slowing economic growth hitting the UK.


| Sales (units) | Selling rate (units/year) | |||||||||
|---|---|---|---|---|---|---|---|---|---|---|
| OCT 2016 | OCT 2015 | Percent change | Year-to-date 2016 | Year-to-date 2015 | Percent change | OCT 2016 | Year-to-date 2016 | Year 2015 | Percentchange | |
| WESTERN EUROPE | 1,046,298 | 1,056,536 | -1.0% | 11,782,016 | 11,085,966 | 6.30% | 13,398,262 | 13,875,944 | 13,185,678 | 5.20% |
| AUSTRIA | 26,344 | 25,149 | 4.80% | 279,180 | 262,342 | 6.40% | 328,257 | 325,392 | 308,555 | 5.50% |
| BELGIUM | 41,969 | 39,474 | 6.30% | 466,352 | 431,996 | 8.00% | 534,757 | 538,645 | 501,066 | 7.50% |
| DENMARK | 17,058 | 16,873 | 1.10% | 185,511 | 171,757 | 8.00% | 205,385 | 220,271 | 207,354 | 6.20% |
| FINLAND | 9,162 | 9,167 | -0.1% | 101,776 | 91,897 | 10.80% | 113,816 | 119,227 | 108,811 | 9.60% |
| FRANCE | 155,201 | 161,737 | -4.0% | 1,656,065 | 1,583,172 | 4.60% | 1,834,704 | 1,982,800 | 1,917,295 | 3.40% |
| GERMANY | 262,724 | 278,372 | -5.6% | 2,818,750 | 2,686,310 | 4.90% | 3,142,246 | 3,368,721 | 3,206,042 | 5.10% |
| GREECE | 5,179 | 4,946 | 4.70% | 68,395 | 63,130 | 8.30% | 68,871 | 79,296 | 75,805 | 4.60% |
| IRELAND | 2,243 | 2,559 | -12.3% | 145,785 | 123,656 | 17.90% | 127,718 | 138,743 | 124,944 | 11.00% |
| ITALY | 146,632 | 133,610 | 9.70% | 1,552,056 | 1,330,883 | 16.60% | 1,783,943 | 1,816,665 | 1,574,651 | 15.40% |
| LUXEMBOURG | 4,077 | 4,398 | -7.3% | 43,460 | 40,425 | 7.50% | 49,154 | 50,484 | 46,473 | 8.60% |
| NETHERLANDS | 30,189 | 38,819 | -22.2% | 316,088 | 339,804 | -7.0% | 399,663 | 384,208 | 448,927 | -14.4% |
| NORWAY | 11,932 | 13,197 | -9.6% | 127,807 | 125,008 | 2.20% | 140,693 | 153,679 | 150,686 | 2.00% |
| PORTUGAL | 14,936 | 13,714 | 8.90% | 173,780 | 152,008 | 14.30% | 200,195 | 206,031 | 178,485 | 15.40% |
| SPAIN | 83,248 | 80,058 | 4.00% | 957,533 | 863,983 | 10.80% | 1,149,178 | 1,138,506 | 1,034,245 | 10.10% |
| SWEDEN | 31,840 | 31,563 | 0.90% | 303,236 | 280,216 | 8.20% | 373,833 | 371,387 | 345,053 | 7.60% |
| SWITZERLAND | 23,396 | 25,236 | -7.3% | 255,579 | 264,829 | -3.5% | 284,308 | 314,484 | 323,783 | -2.9% |
| UK | 180,168 | 177,664 | 1.40% | 2,330,663 | 2,274,550 | 2.50% | 2,661,543 | 2,667,402 | 2,633,503 | 1.30% |


