
Automakers trying to beat their year ago numbers faced a larger than usual challenge in March. Not only was March 2014 a strong sales month, it had one more selling day and, even more important, it had one more sales weekend.
Still, last month’s sales did come in ahead of the same month in 2014, albeit by a slim 8,428 units, which works out to a 0.5% year on year gain.
Go deeper with GlobalData

Discover B2B Marketing That Performs
Combine business intelligence and editorial excellence to reach engaged professionals across 36 leading media platforms.
The seasonally adjusted annualised rate (SAAR) was more impressive, coming in at 17.15m cars and light trucks. That’s the first time since November 2014 the SAAR has been above the 17m mark.
Fiat Chrysler reached its 60th consecutive month of year over year sales improvements as the Chrysler 200 posted all time record sales of nearly 20,000. The margin was slim but the achievement is noteworthy in that FCA overcame big holes left by the now discontinued Dodge Avenger and a 58% drop in minivan sales due to the Windsor (Canada) plant being shut down to retool for the next generation Chrysler minivan.
While car sales helped FCA, they hurt Ford and General Motors. Both reported weak volume, especially for the smaller models, such as the Ford Fiesta and Focus and Chevrolet’s Sonic and Spark. Combined sales of those four models dropped 26.5% in March and are now down 15.6% for the first quarter of 2015.
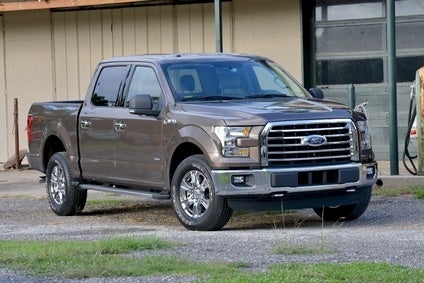
Ford’s problems were compounded by falling sales of the Edge, Escape and Flex SUVs and problems getting production of the new F-150 pickup truck up to speed. GM was at least able to report good truck sales for the month.
Full size pickup sales stumbled last month, falling 0.6% as the Ford F-150 and Ram pickup missed their marks. Sales of the Toyota Tundra also dropped. GM’s Silverado and Sierra pickups reported modest growth.
Sales of mid size pickups continued to soar, up 48.5%, even though the Nissan Frontier came up 12 sales short of its benchmark from last year.
The Japanese automakers broke even last month as gains made by Mitsubishi, Subaru and Toyota were counterbalanced by losses at Honda, Mazda and Nissan. Subaru came through with another monthly sales record.
Hyundai and Kia had record months. Hyundai’s sales came from its car line; its light truck sales were in the red for the month. At Kia, it was just the opposite: cars were soft but truck sales were up 20.5%.
Land Rover was the big news among the European manufacturers. Powered by the LR4 [US nameplate for the Discovery] and Range Rover, sales rocketed up 54.1%.
BMW claimed the top spot in the premium segment for the month and the quarter. Lexus was second in March sales, but Mercedes is still the runner up in year to date deliveries.
Audi’s 51st consecutive monthly sales record and a big jump in Porsche sales were swamped by Volkswagen’s 18.2% nosedive in March. The new Golf is selling nicely, up 133.4%, but everything else seems to be sitting on dealer lots.
Petrol prices are rising again though they’re still a bargain by European standards. However, this doesn’t seem to have impacted buyers’ choices. Mid size and larger SUVs was one of the hottest market segments in March.
The trends still look healthy and there is plenty of optimism in the marketplace. In addition, the pace of introductions at this year’s auto shows means there is exciting product in the pipeline to draw customers to dealer showrooms.
| Manufacturer | Current Month | Volume | Daily Sales | Market Share | Calendar Year-To-Date | Volume | |||
|---|---|---|---|---|---|---|---|---|---|
| Mar-15 | Mar-14 | Change | Rate Change | Feb-15 | Feb-14 | 2015 | 2014 | Change | |
| FCA US LLC | 197261 | 193915 | 1.73% | 5.79% | 12.76% | 12.61% | 505854 | 475964 | 6.28% |
| Ford Motor Co. | 234786 | 243417 | -3.55% | 0.31% | 15.19% | 15.83% | 591900 | 580260 | 2.01% |
| General Motors Co. | 249875 | 256047 | -2.41% | 1.49% | 16.17% | 16.66% | 684039 | 649637 | 5.30% |
| Detroit Total | 681922 | 693379 | -1.65% | 2.28% | 44.12% | 45.10% | 1781793 | 1705861 | 4.45% |
| American Honda | 126293 | 133318 | -5.27% | -1.48% | 8.17% | 8.67% | 333943 | 325354 | 2.64% |
| Mazda North America | 32123 | 34903 | -7.96% | -4.28% | 2.08% | 2.27% | 78044 | 78058 | -0.02% |
| Mitsubishi | 9764 | 8996 | 8.54% | 12.88% | 0.63% | 0.59% | 23790 | 19840 | 19.91% |
| Nissan North America | 145085 | 149136 | -2.72% | 1.18% | 9.39% | 9.70% | 367628 | 354966 | 3.57% |
| Subaru* | 49111 | 44479 | 10.41% | 14.83% | 3.18% | 2.89% | 131281 | 112388 | 16.81% |
| Toyota Motor Sales | 225959 | 215348 | 4.93% | 9.12% | 14.62% | 14.01% | 575620 | 520997 | 10.48% |
| Japan Total | 588335 | 586180 | 0.37% | 4.38% | 38.06% | 38.13% | 1510306 | 1411603 | 6.99% |
| Hyundai* | 75019 | 67005 | 11.96% | 16.44% | 4.85% | 4.36% | 172029 | 160013 | 7.51% |
| Kia* | 58771 | 54777 | 7.29% | 11.58% | 3.80% | 3.56% | 141100 | 133006 | 6.09% |
| Korea Total | 133790 | 121782 | 9.86% | 14.25% | 8.66% | 7.92% | 313129 | 293019 | 6.86% |
| BMW North America | 40139 | 35762 | 12.24% | 16.73% | 2.60% | 2.33% | 91269 | 81034 | 12.63% |
| Daimler AG* | 32883 | 30091 | 9.28% | 13.65% | 2.13% | 1.96% | 85248 | 79475 | 7.26% |
| Jaguar Land Rover | 8438 | 6215 | 35.77% | 41.20% | 0.55% | 0.40% | 21312 | 17794 | 19.77% |
| Maserati North America | 996 | 963 | 3.43% | 7.56% | 0.06% | 0.06% | 1929 | 2368 | -18.54% |
| Volkswagen Group** | 51638 | 55051 | -6.20% | -2.45% | 3.34% | 3.58% | 131279 | 133337 | -1.54% |
| Volvo Cars North America | 5916 | 5915 | 0.02% | 4.02% | 0.38% | 0.38% | 13722 | 13698 | 0.18% |
| Other (est.) | 1653 | 1944 | -14.97% | -11.57% | 0.11% | 0.13% | 4959 | 5832 | -14.97% |
| Europe Total | 141663 | 135941 | 4.21% | 8.38% | 9.16% | 8.84% | 349718 | 333538 | 4.85% |
| Total Light Vehicles | 1545710 | 1537282 | 0.55% | 4.57% | 100.00% | 100.00% | 3954946 | 3744021 | 5.63% |
* indicates a sales record.
**Volkswagen Group figures include Audi, Bentley, Porsche and Volkswagen brands
Other includes estimated sales for Aston-Martin, Ferrari, Lamborghini, Lotus, Rolls-Royce and Tesla
Source: Manufacturer’s reported sales


