
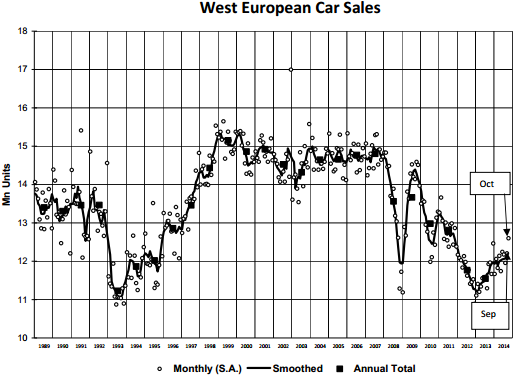
Car sales in Western Europe grew by 5.5% in October according to data released by LMC Automotive.
LMC said that many markets posted stronger selling rates, despite an increasingly gloomy economic outlook for 2015. While eurozone GDP growth forecasts have been pulled back for next year, LMC said it continues to forecast ongoing car market recovery, albeit at a slowing pace compared to 2014. The West European car market is forecast by LMC at 12.46m units for 2015, 2.8% up on 2014’s projected 12.12m units (4.9% ahead of 2013).
Go deeper with GlobalData

Discover B2B Marketing That Performs
Combine business intelligence and editorial excellence to reach engaged professionals across 36 leading media platforms.
LMC noted that registrations improved year-on-year for the fourteenth consecutive month and that the selling rate climbed to 12.6m units a year.
The UK market grew 14.2% in October, keeping it on course to be the largest contributor to the region’s market volume growth for 2014.
The German car market was up by 3.7% in October.
The Spanish market’s selling rate rose to the 1m unit mark, the best selling rate since June 2010. LMC said the latest result reflects the ongoing use of the PIVE incentive scheme along with improving consumer confidence. The Italian market was also up though, at 1.4m units a year, the selling rate remains weak by historical standards.
The French market slipped back from its solid September performance, with the market expected to outturn just over 1.8m units for the full year.
 |
 |
| Sales ( units) | Selling rate (units/year) | |||||||||
|---|---|---|---|---|---|---|---|---|---|---|
| Oct 2014 | Oct 2013 | Percent change | Year-to-d ate 2014 |
Year-to-date 2013 |
Percent change | 10/2/2014 | Year-to-date 2014 |
Year 2013 | Percent change | |
| WESTERN EUROPE | 1,028,2 58 | 97 4,640 | 5.5% | 10259892 | 9,75 4,965 | 5.2% | 1 2,598,085 | 12,059, 771 | 11546042 | 4.4% |
| AUSTRIA | 26,2 97 | 26743 | -1.7% | 263660 | 27 4,854 | -4.1% | 309722 | 308, 960 | 319035 | -3.2% |
| BELGIUM | 38,1 15 | 39490 | -3.5% | 426210 | 42 8,961 | -0.6% | 461025 | 483, 439 | 486065 | -0.5% |
| DENMARK | 16,3 70 | 16872 | -3.0% | 158469 | 15 2,044 | 4.2% | 195960 | 191, 462 | 182198 | 5.1% |
| FINLAND | 8,8 36 | 9093 | -2.8% | 91907 | 90059 | 2.1% | 106677 | 103, 211 | 103450 | -0.2% |
| FRANCE | 160,1 62 | 16 6,495 | -3.8% | 1497131 | 1,47 6,253 | 1.4% | 1799665 | 1,817, 078 | 1790069 | 1.5% |
| GERMANY | 275,3 20 | 26 5,441 | 3.7% | 2556991 | 2,48 2,460 | 3% | 3170768 | 3,060, 843 | 2952431 | 3.7% |
| GREEC E | 5,6 21 | 4971 | 13.1% | 59470 | 48984 | 21.4% | 76094 | 67, 512 | 58696 | 15% |
| IRELAN D | 2,0 42 | 1692 | 20.7% | 95491 | 73405 | 30.1% | 97462 | 97, 211 | 74317 | 30.8% |
| ITALY | 121,7 36 | 11 1,466 | 9.2% | 1158897 | 1,11 2,673 | 4.2% | 1436910 | 1,357, 693 | 1303889 | 4.1% |
| LU XEMBOURG | 4,4 50 | 4499 | -1.1% | 42597 | 40525 | 5.1% | 51334 | 49, 092 | 46624 | 5.3% |
| NETHER LANDS | 35,4 24 | 36315 | -2.5% | 320216 | 33 7,293 | -5.1% | 470590 | 373, 250 | 416863 | -10.5% |
| NO RWAY | 12,9 63 | 12893 | 0.5% | 120067 | 11 8,677 | 1.2% | 149487 | 144, 655 | 142151 | 1.8% |
| PO RTUGAL | 11,7 80 | 9088 | 29.6% | 119148 | 88475 | 34.7% | 155518 | 144, 244 | 105885 | 36.2% |
| SPAIN | 76,0 73 | 60304 | 26.1% | 716601 | 60 6,727 | 18.1% | 970603 | 853, 836 | 722693 | 18.1% |
| SWEDEN | 28,2 52 | 25338 | 11.5% | 250888 | 21 8,445 | 14.9% | 311545 | 308, 022 | 269054 | 14.5% |
| SWITZERLAND | 25,1 02 | 26626 | -5.7% | 244238 | 25 2,892 | -3.4% | 303683 | 294, 392 | 307885 | -4.4% |
| UK | 179,7 14 | 15 7,314 | 14.2% | 2137910 | 1,95 2,238 | 9.5% | 2531041 | 2,404, 872 | 2264737 | 6.2% |
| Notes: | Austria, Denmark, Greece, Luxembo urg and Switzerland: estimates for latest mon th The percen t ch ange in the final column compares the average sellin g rate in the year-to-date with the last full year. |
|||||||||


